

Gain complete visibility and control over your Azure spending with this automated solution that tracks actual costs against budgets across all your subscriptions. Using PowerShell, Bicep, and Log Analytics, this system helps you monitor spending trends, identify budget overruns, and optimize your cloud investments—all with zero maintenance.
The solution collects daily cost data across all your subscriptions, compares it against budgets, and stores everything in a Log Analytics workspace for easy reporting and visualization. The best part? It’s completely automated and secure, using managed identities instead of credentials.
All source code including this blog post is available on GitHub.
Current Challenges in Azure Cost Management
Organizations operating in Azure often face several significant challenges when trying to monitor and control their cloud spending:
Fragmented Budget Visibility
Azure’s native budgeting functionality operates at the individual management group, subscription or resource group level, there is also a significant difference in reporting capacilities between Enterprise Agreements, CSP & PAYG commitments, making it difficult to:
- Get a centralized view of all budgets across multiple subscriptions
- Track overall organizational spending against planned budgets
- Generate a unified report showing budget compliance across the entire environment
Limited Budget vs. Actual Reporting
While Azure Cost Management provides actual cost data, there are key limitations:
- No built-in dashboards that effectively compare budget vs. actual spending across subscriptions
- Missing historical trending of budget compliance over time
- Limited options for automated alerting based on budget-to-actual ratios
Manual Processes and Data Silos
Without a custom solution, organizations typically resort to:
- Manually exporting data from multiple subscriptions
- Creating spreadsheets to combine budget and actual costs
- Building ad-hoc reporting that requires regular maintenance
- Developing separate processes for alerting when budgets are approached
Delayed Insights and Reaction Time
The manual nature of cross-subscription budget monitoring leads to:
- Discovering budget overruns days or weeks after they occur
- Slow reaction time to spending anomalies
- Inability to proactively adjust resources before budgets are exceeded
- Difficulties in attributing costs to specific teams or projects
This solution addresses these challenges by providing an automated, centralized system that collects both budget and actual cost data across all subscriptions, compares them in real-time, and makes this information accessible through customizable dashboards and alerts.
What We’re Building
The solution consists of:
- A resource group in your management subscription
- An Azure Automation account with a system-assigned managed identity
- A Log Analytics workspace with a custom table for cost data
- A Data Collection Rule (DCR) and Data Collection Endpoint (DCE) for modern log ingestion
- A PowerShell runbook that runs daily to collect cost data
- Proper RBAC permissions to access cost data across subscriptions
At a high level, the runbook connects to Azure using the system-assigned managed identity, retrieves cost data for all accessible subscriptions, and streams it to Log Analytics using the Azure Monitor Logs Ingestion API via DCR/DCE. You can then query this data using KQL or visualize it in dashboards.
Prerequisites
Before you begin, make sure you have:
- PowerShell 7.x with the following modules installed:
- Az.Resources
- Az.Automation
- Az.OperationalInsights
- Az.Monitor
- Contributor access to a management subscription where you’ll deploy the solution
- Global Administrator or User Access Administrator to assign roles across subscriptions
Project Structure
Here’s the file structure for the solution with links to each file:
Budget vs Cost/
├── deploy.ps1                  # Main deployment script
├── main.bicep                  # Main Bicep template (subscription level)
├── main.parameters.json        # Parameters for Bicep deployment
├── post-deploy-roles.ps1       # Script to assign necessary RBAC roles
├── resources.bicep             # Resource definitions for Bicep
└── Script/
    └── RetrieveConsumptionUpdate.ps1  # The actual runbook script
File References
- deploy.ps1 – Main deployment script that orchestrates the entire setup
- main.bicep – Subscription-level Bicep template that creates the resource group and calls the resources module
- main.parameters.json – Parameters file that defines resource names and tags
- post-deploy-roles.ps1 – Script that assigns necessary RBAC roles to the system-assigned identity
- resources.bicep – Resource group-level Bicep template defining all Azure resources
- Script/RetrieveConsumptionUpdate.ps1 – PowerShell runbook that collects cost data and uploads it to Log Analytics
How It Works
1. Bicep Infrastructure-as-Code {#bicep-templates}
Our solution uses Bicep to define and deploy all the required Azure resources:
main.bicepcreates the resource group and invokes the resources moduleresources.bicepdefines all individual resources:- Azure Automation account with a system-assigned managed identity
- Log Analytics workspace with a custom table schema
- Data Collection Endpoint (DCE) for modern log ingestion
- Data Collection Rule (DCR) to define the data flow
- Automation variables to store connection details
- Role assignments for secure access
2. Role Assignments {#rbac-configuration}
The post-deploy-roles.ps1 script assigns proper RBAC roles to the Automation Account’s managed identity:
- Cost Management Reader on all subscriptions
- Log Analytics Contributor and Reader for the Log Analytics workspace
- Monitoring Metrics Publisher for both the DCR and DCE
3. PowerShell Runbook
The core functionality is in the Script/RetrieveConsumptionUpdate.ps1 runbook script, which:
- Authenticates using the system-assigned managed identity
- Gets a list of all accessible subscriptions
- For each subscription:
- Retrieves cost data for the specified period
- Gets any configured budgets
- Calculates budget usage percentages
- Prepares a structured dataset with all the cost information
- Uses the modern Azure Monitor Logs Ingestion API to stream data directly to Log Analytics
4. Data Storage and Querying
The cost data is stored in a custom Log Analytics table named CostManagementData_CL, which you can query using KQL.
Deployment Instructions
To deploy the solution:
- Ensure you have all the prerequisites installed
- Clone or download this repository
- Open PowerShell as an administrator
- Navigate to the repository folder
- Connect to Azure using
Connect-AzAccount - Run the deployment script:
.\deploy.ps1
The deploy.ps1 script will take a few minutes to execute, during which it will:
- Create or update all required resources
- Upload and publish the runbook script
- Schedule the runbook to run daily
- Configure Automation Account variables
- Set up all necessary RBAC permissions
Querying the Cost Data
Once the runbook has executed successfully, you can query the data in Log Analytics. Here are some useful KQL queries:
Basic query to see all cost data
CostManagementData_CL
| sort by TimeGenerated desc
Monthly costs by subscription
CostManagementData_CL
| where TimeGenerated > ago(90d)
| summarize arg_max(TimeGenerated, *) by SubscriptionName, Month, Year
| project SubscriptionName,
         CostAmount = round(CostAmount, 0),
         BudgetAmount = round(BudgetAmount, 0),
         BudgetUsedPercent = round(BudgetUsedPercent, 0),
         Month,
         Year
| sort by Year desc, Month desc, CostAmount desc
Subscriptions over budget
CostManagementData_CL
| where TimeGenerated > ago(7d)
| where BudgetAmount > 0
| where CostAmount > BudgetAmount
| summarize arg_max(TimeGenerated, *) by SubscriptionName
| project SubscriptionName, CostAmount = round(CostAmount, 0), BudgetAmount = round(BudgetAmount, 0), BudgetUsedPercent = round(BudgetUsedPercent, 0)
| sort by BudgetUsedPercent desc
Month over Month variance
// Month over month variance for subscriptions in the last 3 months
let months = 3;
let data = CostManagementData_CL
| where TimeGenerated > ago(120d)  // Get enough data to ensure we have 3 months
| summarize arg_max(TimeGenerated, *) by SubscriptionName, Month, Year
| extend MonthOrder = case(
    Month == "January", 1,
    Month == "February", 2,
    Month == "March", 3,
    Month == "April", 4,
    Month == "May", 5,
    Month == "June", 6,
    Month == "July", 7,
    Month == "August", 8,
    Month == "September", 9,
    Month == "October", 10,
    Month == "November", 11,
    Month == "December", 12,
    0
)
| extend YearMonth = datetime(strcat(tostring(Year), "-", padleft(tostring(MonthOrder), 2, "0"), "-01"))
| project SubscriptionName, YearMonth, CostAmount, MonthOrder, Year;

// Get the 3 most recent months in the data
let latestMonths = data
| summarize max(YearMonth) by YearMonth
| top 3 by YearMonth desc
| project YearMonth;

// Filter data to only include those 3 months
let filteredData = data
| where YearMonth in (latestMonths);

// Calculate current month, previous month, and month before previous
let current = filteredData
| top 1 by YearMonth desc
| project CurrentMonth = YearMonth;

let previous = filteredData
| top 2 by YearMonth desc
| top 1 by YearMonth asc
| project PreviousMonth = YearMonth;

let beforePrevious = filteredData
| top 3 by YearMonth desc
| top 1 by YearMonth asc
| project BeforePreviousMonth = YearMonth;

// Join all months together
filteredData
| summarize CostAmount = sum(CostAmount) by SubscriptionName, YearMonth
| extend Month = monthofyear(YearMonth), Year = year(YearMonth)
| extend MonthName = case(
    Month == 1, "January",
    Month == 2, "February",
    Month == 3, "March",
    Month == 4, "April",
    Month == 5, "May",
    Month == 6, "June",
    Month == 7, "July",
    Month == 8, "August",
    Month == 9, "September",
    Month == 10, "October",
    Month == 11, "November",
    Month == 12, "December",
    "Unknown"
)
| extend MonthYear = strcat(MonthName, " ", Year)
| summarize CurrentCost = sumif(CostAmount, YearMonth == toscalar(current)),
            PreviousCost = sumif(CostAmount, YearMonth == toscalar(previous)),
            BeforePreviousCost = sumif(CostAmount, YearMonth == toscalar(beforePrevious))
            by SubscriptionName
| extend
    CurrentMonth = monthofyear(toscalar(current)),
    PreviousMonth = monthofyear(toscalar(previous)),
    BeforePreviousMonth = monthofyear(toscalar(beforePrevious)),
    CurrentYear = year(toscalar(current)),
    PreviousYear = year(toscalar(previous)),
    BeforePreviousYear = year(toscalar(beforePrevious))
| extend
    CurrentMonthName = case(
        CurrentMonth == 1, "January",
        CurrentMonth == 2, "February",
        CurrentMonth == 3, "March",
        CurrentMonth == 4, "April",
        CurrentMonth == 5, "May",
        CurrentMonth == 6, "June",
        CurrentMonth == 7, "July",
        CurrentMonth == 8, "August",
        CurrentMonth == 9, "September",
        CurrentMonth == 10, "October",
        CurrentMonth == 11, "November",
        CurrentMonth == 12, "December",
        "Unknown"
    ),
    PreviousMonthName = case(
        PreviousMonth == 1, "January",
        PreviousMonth == 2, "February",
        PreviousMonth == 3, "March",
        PreviousMonth == 4, "April",
        PreviousMonth == 5, "May",
        PreviousMonth == 6, "June",
        PreviousMonth == 7, "July",
        PreviousMonth == 8, "August",
        PreviousMonth == 9, "September",
        PreviousMonth == 10, "October",
        PreviousMonth == 11, "November",
        PreviousMonth == 12, "December",
        "Unknown"
    ),
    BeforePreviousMonthName = case(
        BeforePreviousMonth == 1, "January",
        BeforePreviousMonth == 2, "February",
        BeforePreviousMonth == 3, "March",
        BeforePreviousMonth == 4, "April",
        BeforePreviousMonth == 5, "May",
        BeforePreviousMonth == 6, "June",
        BeforePreviousMonth == 7, "July",
        BeforePreviousMonth == 8, "August",
        BeforePreviousMonth == 9, "September",
        BeforePreviousMonth == 10, "October",
        BeforePreviousMonth == 11, "November",
        BeforePreviousMonth == 12, "December",
        "Unknown"
    )
| extend
    CurrentMonthYear = strcat(CurrentMonthName, " ", CurrentYear),
    PreviousMonthYear = strcat(PreviousMonthName, " ", PreviousYear),
    BeforePreviousMonthYear = strcat(BeforePreviousMonthName, " ", BeforePreviousYear)
| extend
    CurrentToPreviousVariance = round(CurrentCost - PreviousCost, 0),
    PreviousToBeforePreviousVariance = round(PreviousCost - BeforePreviousCost, 0),
    CurrentToPreviousVariancePct = iif(PreviousCost > 0, round(((CurrentCost - PreviousCost) / PreviousCost) * 100, 1), 0),
    PreviousToBeforePreviousVariancePct = iif(BeforePreviousCost > 0, round(((PreviousCost - BeforePreviousCost) / BeforePreviousCost) * 100, 1), 0)
| extend
    CurrentTrend = case(
        CurrentToPreviousVariancePct > 10, "↑↑ Significant Increase",
        CurrentToPreviousVariancePct between (2 .. 10), "↑ Moderate Increase",
        CurrentToPreviousVariancePct between (-2 .. 2), "→ Stable",
        CurrentToPreviousVariancePct between (-10 .. -2), "↓ Moderate Decrease",
        "↓↓ Significant Decrease"
    ),
    PreviousTrend = case(
        PreviousToBeforePreviousVariancePct > 10, "↑↑ Significant Increase",
        PreviousToBeforePreviousVariancePct between (2 .. 10), "↑ Moderate Increase",
        PreviousToBeforePreviousVariancePct between (-2 .. 2), "→ Stable",
        PreviousToBeforePreviousVariancePct between (-10 .. -2), "↓ Moderate Decrease",
        "↓↓ Significant Decrease"
    )
| project
    SubscriptionName,
    ["Month 3 (Current)"] = CurrentMonthYear,
    ["Month 3 Cost"] = round(CurrentCost, 0),
    ["Month 2"] = PreviousMonthYear,
    ["Month 2 Cost"] = round(PreviousCost, 0),
    ["Month 1 (Oldest)"] = BeforePreviousMonthYear,
    ["Month 1 Cost"] = round(BeforePreviousCost, 0),
    ["M3 to M2 Variance"] = CurrentToPreviousVariance,
    ["M3 to M2 Variance %"] = CurrentToPreviousVariancePct,
    ["M3 to M2 Trend"] = CurrentTrend,
    ["M2 to M1 Variance"] = PreviousToBeforePreviousVariance,
    ["M2 to M1 Variance %"] = PreviousToBeforePreviousVariancePct,
    ["M2 to M1 Trend"] = PreviousTrend
| sort by ["Month 3 Cost"] desc
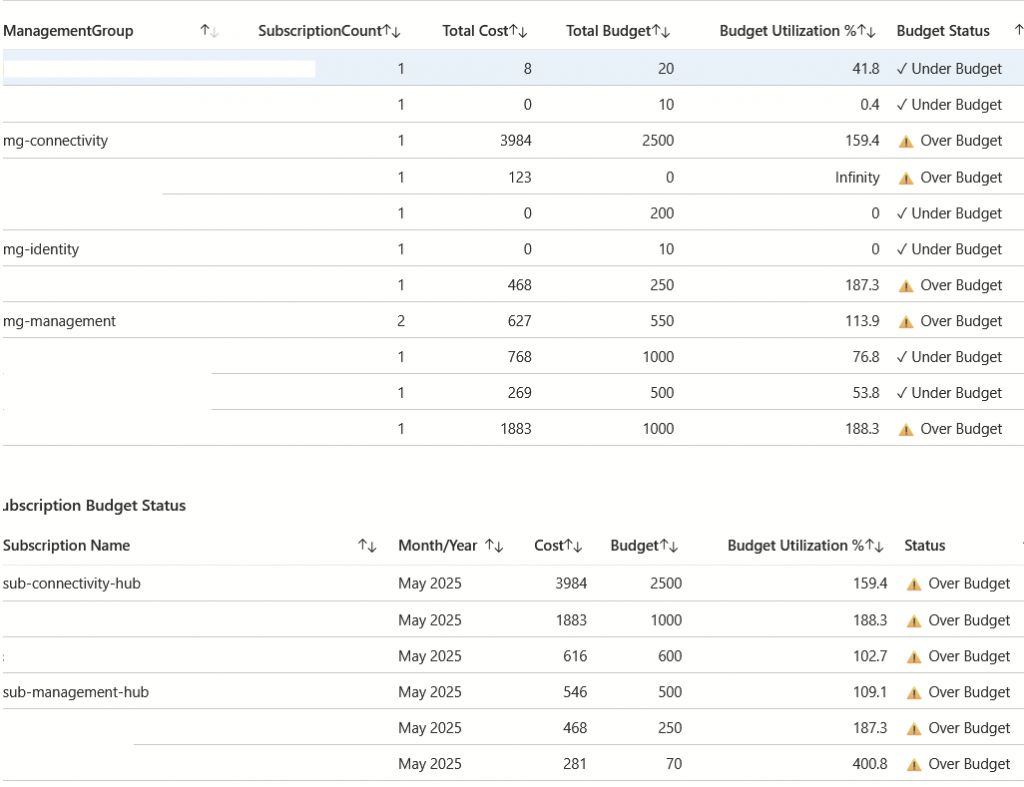
KQL Queries by Management Group
1. Cost by Management Group Hierarchy
CostManagementData_CL
| where TimeGenerated > ago(90d)
| where ManagementGroup != "No Data"
| summarize arg_max(TimeGenerated, *) by SubscriptionName
| summarize TotalCost = sum(CostAmount),
          TotalBudget = sum(BudgetAmount),
          SubscriptionCount = count()
  by ManagementGroupPath
| extend BudgetUtilization = round((TotalCost / TotalBudget) * 100, 0)
| project ManagementGroupPath,
         TotalCost = round(TotalCost, 0),
         TotalBudget = round(TotalBudget, 0),
         BudgetUtilization,
         SubscriptionCount
| sort by TotalCost desc
2. Top-level Management Group Spending
CostManagementData_CL
| where TimeGenerated > ago(30d)
| where ManagementGroup != "No Data"
| summarize arg_max(TimeGenerated, *) by SubscriptionName
| extend TopLevelMG = tostring(split(ManagementGroupPath, '/')[0])
| summarize TotalCost = sum(CostAmount) by TopLevelMG
| project TopLevelMG,
         TotalCost = round(TotalCost, 0)
| sort by TotalCost desc
3. Budget Compliance by Management Group
CostManagementData_CL
| where TimeGenerated > ago(30d)
| where BudgetAmount > 0
| summarize arg_max(TimeGenerated, *) by SubscriptionName
| extend BudgetStatus = case(
    CostAmount > BudgetAmount, "Over Budget",
    CostAmount > BudgetAmount * 0.9, "Near Limit",
    "Under Budget"
  )
| summarize OverBudgetCount = countif(BudgetStatus == "Over Budget"),
           NearLimitCount = countif(BudgetStatus == "Near Limit"),
           UnderBudgetCount = countif(BudgetStatus == "Under Budget"),
           TotalSubscriptions = count()
  by ManagementGroup
| extend ComplianceRate = round((UnderBudgetCount / TotalSubscriptions) * 100, 0)
| project ManagementGroup,
         OverBudgetCount,
         NearLimitCount,
         UnderBudgetCount,
         TotalSubscriptions,
         ComplianceRate
| sort by ComplianceRate asc
Creating Visualizations
You can create rich visualizations using Azure Monitor Workbooks:
- Go to your Log Analytics workspace
- Navigate to “Workbooks” in the left menu
- Click “New”
- Add a new query with one of the KQL examples above
- Change the visualization type (e.g., Bar chart, Pie chart)
- Save and pin the workbook to a dashboard
Technical Details
Resource Definitions
The resources.bicep file defines all the Azure resources needed for this solution:
- Automation Account: Hosts and runs the PowerShell runbook
- Log Analytics Workspace: Stores and indexes the cost data
- Custom Table: Defines the schema for the cost data
- Data Collection Endpoint (DCE): Provides the ingestion endpoint
- Data Collection Rule (DCR): Configures the data flow to Log Analytics
- Automation Variables: Store configuration for the runbook
Modern Log Ingestion (DCR/DCE)
This solution uses Azure Monitor’s modern Data Collection Rules (DCR) and Data Collection Endpoints (DCE) for log ingestion:
- DCE: Provides the endpoint URL for data ingestion
- DCR: Defines the data stream details and destination
- Automation Variables: Store the DCE endpoint and DCR immutable ID for the runbook
The runbook uses the DCE/DCR to send data via the Azure Monitor Logs Ingestion API, which is the preferred method for custom logs going forward.
RBAC Security Model
The solution uses a least-privilege security model:
- System-assigned managed identity instead of credentials or service principals
- Fine-grained RBAC permissions only for needed operations
- Cost Management Reader role instead of broader permissions
Parameters Configuration {#parameters-configuration}
The solution uses the main.parameters.json file to configure resource names, locations, and tags. You can modify this file to customize the deployment for your environment.
Currency Configuration
The solution defaults to using EUR as the currency. To change this:
- Open
Script/RetrieveConsumptionUpdate.ps1 - Find the line
Currency = "EUR"(around line 101) - Replace “EUR” with your local currency code (e.g., “USD”, “GBP”, etc.)
Troubleshooting
Common Issues
Error: “Required PowerShell module is not installed”
Install the missing module using Install-Module -Name <ModuleName> -Force
Error: “You are not logged in to Azure”
Connect to Azure using Connect-AzAccount
Error: “Could not find Log Analytics workspace”
Verify the workspace name in main.parameters.json matches your environment
Error: “Authentication failed”
Ensure the Automation Account has its system-assigned identity enabled
Error: “Failed to send data to Azure Monitor”
Check that the DCR and DCE are properly configured and the managed identity has the correct permissions
Checking Runbook Status
To check if your runbook is running successfully:
- Go to the Azure Portal
- Navigate to your Automation Account
- Click on “Jobs” under “Process Automation”
- Look for the latest execution of “AnalyzeCostManagementData”
- Check the output and any error messages
Extending the Solution
You can extend this solution by:
- Creating custom alerts when costs exceed thresholds
- Building Power BI dashboards connected to Log Analytics
- Adding more granular data collection (e.g., resource group level costs)
- Integrating with other systems through Logic Apps or Azure Functions
- Implementing recommendations for cost optimization
Conclusion
This automated Azure cost management solution provides a comprehensive view of your cloud spending across all subscriptions. By leveraging infrastructure-as-code with Bicep, secure authentication with managed identities, and modern log ingestion with DCR/DCE, you get a robust and maintainable solution that can help you monitor and control your Azure costs effectively.
Note: This solution is provided as-is without warranty of any kind. Always test in a non-production environment first.
Note: Claude.AI & ChatGPT4.o were used to analyse the challenge and visualisation idea. Code generation was done based on output of Claude.AI with a manual fix of certain custom values.