
In this blog-post, we will be going into more detail on which performance counters are required to fully make use of Windows Virtual Desktop insights and how to keep an eye on our monitoring costs.
Under the hood
WVD Insights (Public Preview) uses a couple of key Azure Services to provide valuable monitoring and insights over your Windows Virtual Desktop environment.
| Azure Monitor | Log Analytics | Azure Workbooks |
Azure Monitor for Windows Virtual Desktop uses Log Analytics to gather all of our data, and this data is split up between two major parts.
- WVD resource diagnostics
- Session host diagnostics
WVD resource diagnostics
To monitor and retrieve data related to the supporting WVD infrastructure, WVD resource diagnostics need to be enabled on the following levels. The following Microsoft article describes what is logged.
The amount of log data stored in log analytics varies depending on the size and amount of users that connect to your environment.
| Workspace | Checkpoint |
| Error | |
| Management | |
| Feed | |
| Hostpool | Checkpoint |
| Error | |
| Management | |
| Connection | |
| HostRegistration | |
| AgentHealthStatus | |
| Application Group | Checkpoint |
| Error | |
| Management |
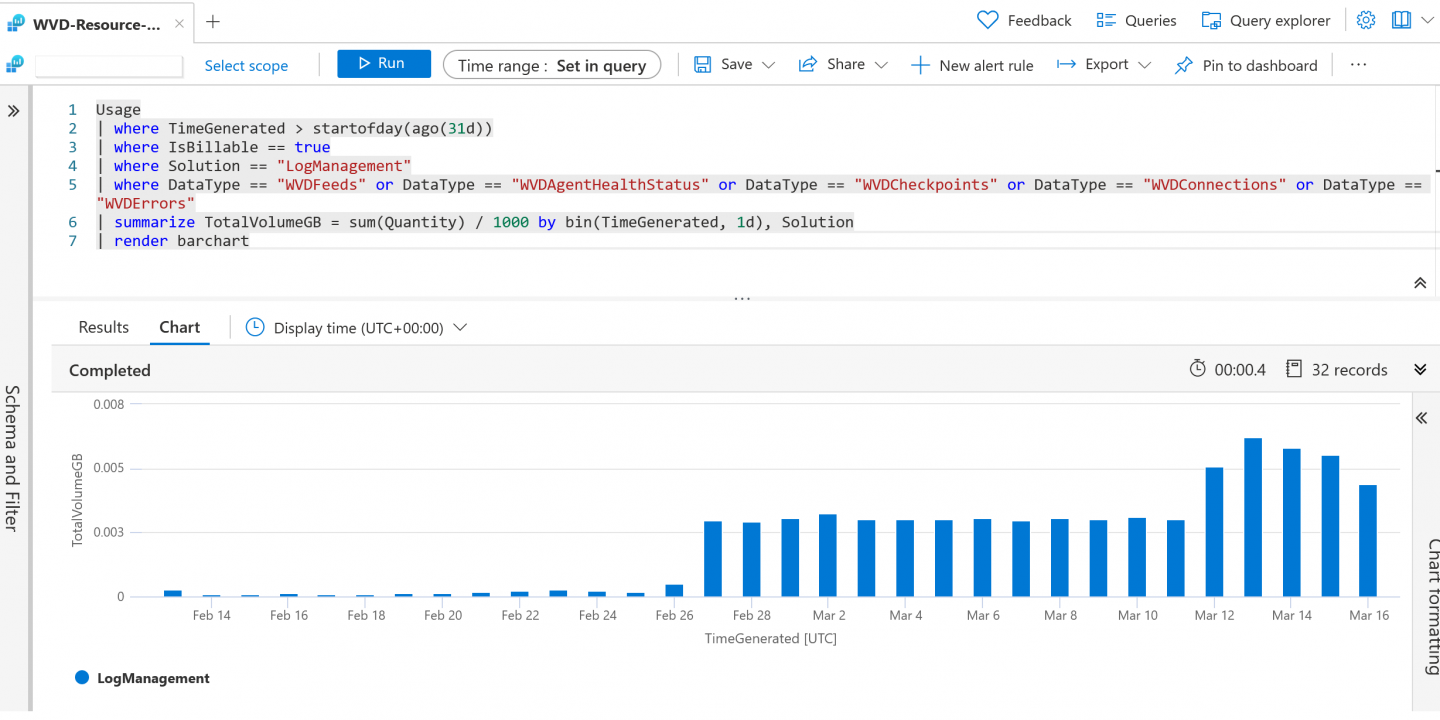
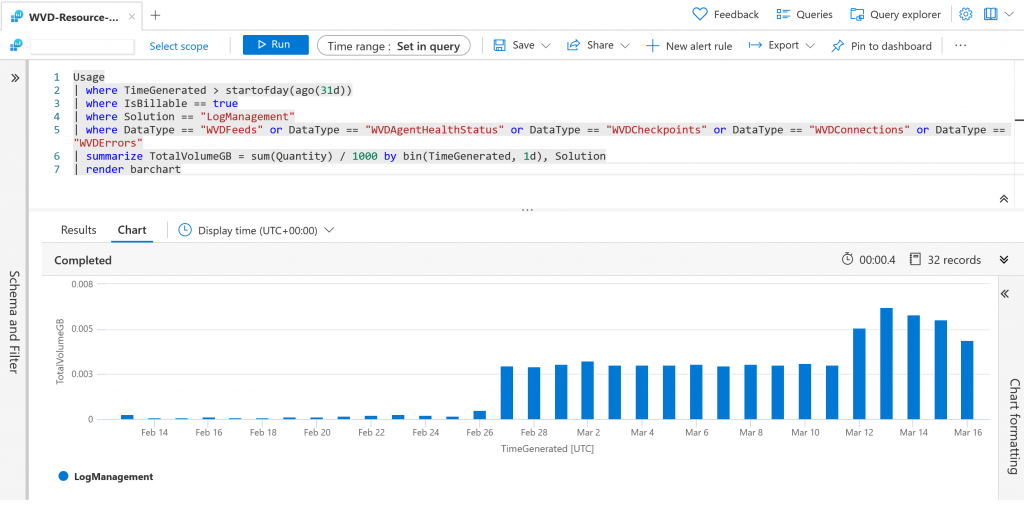
The following kusto query can help you determine the amount of data ingested into Log Analytics by the overall WVD infrastructure. Feel free to try it out on your Log Analytics workspace.
Usage
| where TimeGenerated > startofday(ago(31d))
| where IsBillable == true
| where Solution == "LogManagement"
| where DataType == "WVDFeeds" or DataType == "WVDAgentHealthStatus" or DataType == "WVDCheckpoints" or DataType == "WVDConnections" or DataType == "WVDErrors"
| summarize TotalVolumeGB = sum(Quantity) / 1000 by bin(TimeGenerated, 1d), Solution
| render barchart
When looking at the WVD resource logs, we don’t see a large amount of data stored here. As a reference case, the screenshot below provides insights on a host pool containing 2 session hosts and accessed by 10 remote app users.
Session host diagnostics
Your session hosts’ actual performance is monitored by “session host diagnostics”, we distinguish two types of data.
| Event Logs | Performance Counters |
Event Logs
In this blog-post, we will be focusing on the collection of performance counters. The average data ingestion of Event Logs is only a small percentage compared to the data generated by enabling the performance counters.
Performance Counters
Performance Counters and Event Logs have been around for quite some time now. Many 3rd party monitoring tools hook into the existing performance counters and logs provided by default within a Windows Operating System. Log Analytics uses the exact mechanism. With Log Analytics, you can select which counters and logs are being retrieved and at which interval they are stored in your workspace.
When monitoring your Windows Virtual Desktop environment, it’s not uncommon that you want to enable all performance counters and want to collect all logs. It’s even just a few clicks away when you look at the configuration workbook. But be warned, as you can see in the screenshots below, it’s quite an extensive list of counters and logs that we can gather.


The following table represents the list of Performance Counters enabled per Windows Virtual Desktop Session host. A total of 28 counters is what we are looking at, at a sample rate between 30– 60 seconds. This means every 30-60 seconds data will be ingested into Log Analytics.
| ObjectName | CounterName | Interval |
| LogicalDisk | Avg. Disk sec/Transfer | 60 |
| LogicalDisk | % Free Space | 60 |
| Network Interface | Bytes Total/sec | 60 |
| Process | % User Time | 60 |
| Process | % Processor Time | 60 |
| Process | Thread Count | 60 |
| Processor | % Processor Time | 60 |
| System | Processor Queue Length | 60 |
| Terminal Services | Active Sessions | 60 |
| Terminal Services | Inactive Sessions | 60 |
| Terminal Services | Total Sessions | 60 |
| Process | IO Read Operations/sec | 60 |
| Process | IO Write Operations/sec | 60 |
| LogicalDisk | Current Disk Queue Length | 30 |
| LogicalDisk | Avg. Disk Queue Length | 30 |
| Memory | Available Mbytes | 30 |
| Memory | Page Faults/sec | 30 |
| Memory | Pages/sec | 30 |
| Memory | % Committed Bytes In Use | 30 |
| PhysicalDisk | Avg. Disk sec/Read | 30 |
| PhysicalDisk | Avg. Disk sec/Transfer | 30 |
| PhysicalDisk | Avg. Disk sec/Write | 30 |
| PhysicalDisk | Avg. Disk Queue Length | 30 |
| Processor Information | % Processor Time | 30 |
| RemoteFX Network | Current UDP Bandwidth | 30 |
| RemoteFX Network | Current TCP RTT | 30 |
| User Input Delay per Process | Max Input Delay | 30 |
| User Input Delay per Session | Max Input Delay | 30 |
Small calculation
15 counters x (86.400 seconds in a day / 30 seconds) = 43200 metrics per day
13 counters x (86.400 seconds in a day / 60seconds) = 18720 metrics per day
This leads us to a total of 61920 metrics per day for 1 session host. Now, this might sound logical. However, this calculation is not correct.
When looking at the sizing estimates provided by Microsoft, the calculation is as follows:
XX MB x (number of counters) x (number of agents) x (number of instances)
So what we are missing in our calculation is the number of instances. For example, we have a counter called “% Processor Time” but this is not a single instance counter, “% Processor Time” has many underlying instances for each process that is running on the host. The following screenshot provides you with some more details on the type of instances per counter.

Since the number of instances is challenging to calculate upfront, depending on the size of your session host and the amount of users/applications/processes, in our further calculations, we will be working with averages that we’ve seen in recent environments.
The below table presents the average instances per counter on a host with 10-12 concurrent full desktop users.
| ObjectName | CounterName | Interval | Instances |
| LogicalDisk | Avg. Disk sec/Transfer | 60 | 40 |
| LogicalDisk | % Free Space | 60 | 30 |
| Network Interface | Bytes Total/sec | 60 | 1 |
| Process | % User Time | 60 | 50 |
| Process | % Processor Time | 60 | 50 |
| Process | Thread Count | 60 | 50 |
| Processor | % Processor Time | 60 | 1 |
| System | Processor Queue Length | 60 | 1 |
| Terminal Services | Active Sessions | 60 | 1 |
| Terminal Services | Inactive Sessions | 60 | 1 |
| Terminal Services | Total Sessions | 60 | 1 |
| Process | IO Read Operations/sec | 60 | 50 |
| Process | IO Write Operations/sec | 60 | 50 |
| LogicalDisk | Current Disk Queue Length | 30 | 30 |
| LogicalDisk | Avg. Disk Queue Length | 30 | 1 |
| Memory | Available Mbytes | 30 | 1 |
| Memory | Page Faults/sec | 30 | 1 |
| Memory | Pages/sec | 30 | 1 |
| Memory | % Committed Bytes In Use | 30 | 1 |
| PhysicalDisk | Avg. Disk sec/Read | 30 | 12 |
| PhysicalDisk | Avg. Disk sec/Transfer | 30 | 40 |
| PhysicalDisk | Avg. Disk sec/Write | 30 | 12 |
| PhysicalDisk | Avg. Disk Queue Length | 30 | 1 |
| Processor Information | % Processor Time | 30 | 1 |
| RemoteFX Network | Current UDP Bandwidth | 30 | 50 |
| RemoteFX Network | Current TCP RTT | 30 | 50 |
| User Input Delay per Process | Max Input Delay | 30 | 30 |
| User Input Delay per Session | Max Input Delay | 30 | 50 |
Re-calculation
This leads us to re-calculate our previous method.
15 counters turns into a total of 374 instances (Sum of instances with a 30 sec interval)
13 counters turns into a total of 694 instances (Sum of instances with a 60 sec interval)
374 x (86.400 seconds in a day/ 30 seconds) = 1077120 metrics per day
694 x (86.400 seconds in a day/ 60seconds) = 999360 metrics per day
This gives us a total of 2076480 metrics per host per day.
Data ingestion per metric
Now that we have an average of metrics per day per session host let’s look at how much data a performance metric produces.
Credits go to Christoph Petersen, who wrote this excellent kusto query to analyze the average data ingestion per data type. The original query can be found here. I’ve made some minor changes to the query to retrieve the information we need for this use case.
let daystoSearch = 31d;
let tables = search *
| where TimeGenerated >= ago(daystoSearch)
| summarize  RecordCount=count() by $table
| project leftName=$table, RecordCount, Clause=1 ;
Usage
| where TimeGenerated >= ago(daystoSearch)
| where IsBillable == true
| where DataType !=""
| summarize TotalSize=sum(Quantity) by DataType
| project rightName=DataType, TotalSize, Clause=1
| join kind=leftouter (tables) on Clause
| where leftName == rightName
| project TableName=leftName , MBperRecord=round(TotalSize / RecordCount,6), RecordCount, TotalGB = round(TotalSize/1024, 6)
| sort by MBperRecord desc
| where TableName == "Perf" or TableName == "WVDManagement" or TableName == "WVDCheckpoints" or TableName  == "WVDFeeds" or TableName == "WVDConnections" or TableName == "WVDAgentHealthStatus" or TableName == "Event"
The Log Analytics query above provides us with the following result.

On average we ingest about 0,00023 MB per performance counter metric. This leads us to the following calculation.
Final Calculation
Now that we have our data to work with let’s calculate the cost of enabling the Windows Virtual Desktop Insights performance counters on a monthly basis.
# Metrics/Day/Host = 2076480
# MB/Metric = 0,00023 MB
# Days/Month = 31
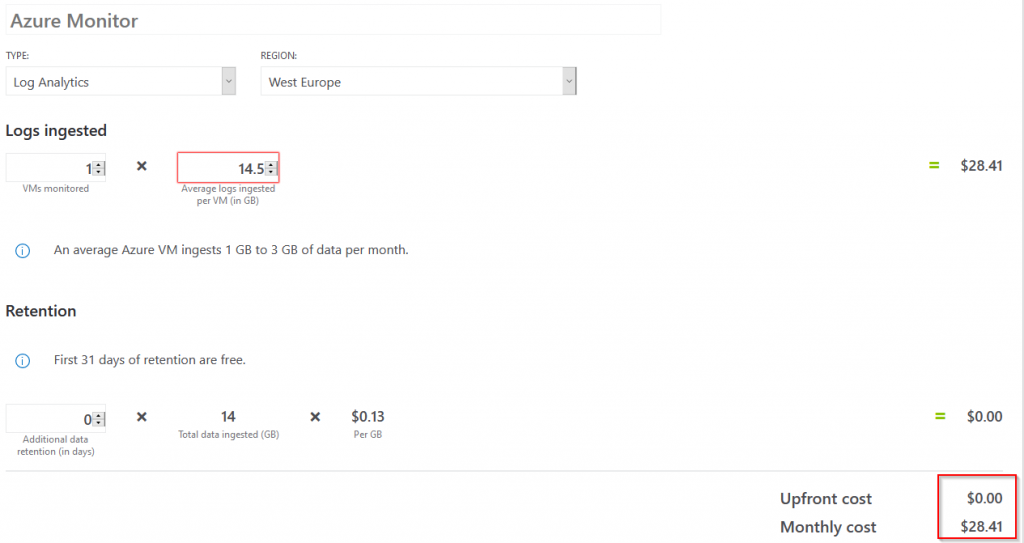
2076480 x 0,00023 x 31 = 14805,3 MB/Month
This leads us to conclude that by enabling WVD Insights, we generate an average of 14,5 GB per session host per month. When entering these details in the Azure Calculator, we end up having a cost of $28,41 per session host.
Counter update 25/03/2021
A recent update to the Azure Monitor for Windows Virtual Desktop guidelines reduces the overall costs for monitoring WVD by 80%.
In practice it reduces the costs with about 60%.
The following counters have been removed from the default set of counters deployed by the configuration workbook.
- Process(*)\% Processor Time
- Process(*)\% User Time
- Process(*)\ Thread count
- Process(*)\ IO Write Operations/second
- Process(*)\ IO Read Operations/second
If you have deployed the configuration workbook in the past, you will need to manually remove the previously mentioned performance counters.
Final Calculation Update 25/03/2021
With the updated performance counters provided by Microsoft we have a new set of data to work with, let’s calculate the cost of enabling the Windows Virtual Desktop Insights performance counters on a monthly basis.
#Metrics/Day/Host = 1356480
#MB/Metric = 0,00023 MB
#Days/Month = 32
1356480 x 0,00023 x 31 = 9671,7 MB/Month
This leads us to a new calculation, concluding that by enabling WVD Insights, we generate an average of 9,6 GB per session host per month. When entering these details in the Azure Calculator, we have a cost of $13,75 per session host.

Next Steps
To keep your monitor costs under control there are a couple of next steps that you could take.
- Change the performance counter interval.
- Disable/Enable the performance counters that provide valuable insights for your specific use case.
- Try working with Budget Forecasting in Azure Cost Management.
Thank you!
Thank you for reading through this blog post. I hope I have been able to assist in calculating and managing monitoring costs for your Windows Virtual Desktop environment.
If you encounter any new insights, feel free to drop me a comment or contact me via mail or other social media channels
2 Comments on “How to keep control over your Windows Virtual Desktop Insights logs and costs”